There are so many useful debugging features built into Visual Studio that aren’t well-known. Here are a few of my favourites, including some recent finds in VS 2013.
1. Breakpoint inside a lambda
Clicking the left gutter to set breakpoints, you could easily believe breakpoints happen at line-level.
Breakpoints, though, can be set inside parts of the line, such as inside a lambda in your LINQ expression. Just right-click the part of the code and choose Breakpoint > Insert Breakpoint from the context menu.
2. Usable output window

The output window is useful for debugging where breakpoints would be too invasive or interrupt flow but for the noise.
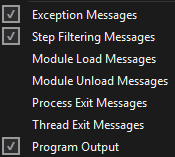
Just right-click in the output window (make sure output is set to debug) and turn off the Module Load, Module Unload, Process Exit and Thread Exit to leave you with information you care about. Now Debug.WriteLine to your heart’s content.
You can also press CtrlS in the output window to save the contents.
3. Attach debugger to client and server (VS 2012)
It’s useful to have both server and client projects in a single solution so that you only need one copy of Visual Studio running. It's all too easy to get lost alt-tabbing back and forth - especially when they share code such as a data model project.
One disadvantage is that the startup project is the only one to get a debugger attached. If you encounter an exception, it shows in your client, not your server project.
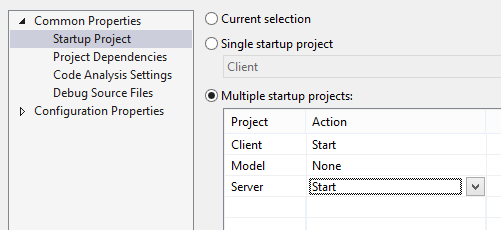
That’s easily solved now. Right-click on the solution, choose properties and choose Multiple startup projects then select the Start action for the projects you need to attach to.

4. Create a repro project template
If you’re responsible for a SDK or API create a simple application that uses your stuff in a small self-contained way. Then use File > Export template… to save it.
Now you can create a new project from your template whenever you need it with a few clicks. Even better, make it available to users and testers so they can send you minimal repros.
5. Use the DebuggerDisplay attribute
By default, the debugger uses ToString() for watch and auto windows which output the class name. Even if you override ToString it’s probably not what somebody debugging wants to see at a glance.
Add DebuggerDisplay to your class with a simple expression to evaluate properties instead. e.g.:
[DebuggerDisplay("Order {ID,nq}")
class Order {
    public string ID { get { return id; } }
}
The nq prevents double-quotes from being emitted. You can also use methods here too, but don’t do anything with subtle side-effects; otherwise, your observation of the subject changes its behaviour and can cause weird hard-to-track-down issues.
6. Manage breakpoints
You set-up some interesting breakpoints. Now you need to switch one off as it’s getting hit too often but you’ll need it again in a minute. If you remove the breakpoint, you’ll have to come back and find it again.
Enter the much-overlooked Breakpoints window CtrlAltB. This will show all breakpoints you have set but crucially lets you disable them without un-setting them by simply removing the check-mark. Check it again to re-enable it.

This window also provides the ability to quickly:
- Condition when a breakpoint should occur
- Hit count to see how often it is hit, and to break only on that count
- Label a breakpoint to allow toggling on and off in batches
- When Hit to put a message in the output window instead of actually breaking
7. Break on or output the caller information (.NET 4.5/Windows 8 Store)
There isn’t a global variable for the current method of the caller. Getting the current stack is a slow operation.
One quick and simple trick is to add an extra optional string parameter to the method with the CallerMemberName attribute. e.g.
void MyFunction(string someValue, [CallerMemberName] string caller = null) {
    ...
}
Because it is an optional value, you don’t need to modify any callers, but you can now:
- Set a breakpoint condition inside DoSomething based on the caller variable
- Output the contents of the caller to a log or output window
You can also use CallerLineNumber and CallerFilePath. Also remember that constructors, finalizers and operator overloads will display their underlying method names (.ctor, op_Equals etc).
8. See the value returned by a function (VS 2013, .NET 4.5.1/Windows 8.1 Store)
 Sometimes you want to see what a function returned, but you can’t easily because you didn’t store the value because it was the input to another function.
Support was added in VS 2013 but is incredibly easy to miss as you have to be in the right place at the right time. The right place is the Autos window, and the right time is exactly the step that returned you to where the function was called from. You won’t see this before you call the function or while in the function. It’s there for a single step and looks like this:
The arrow icon indicates it’s a return value, and it lets you know the name of the function alongside it.
Wrap up
I also can’t stress enough how useful having logs are for troubleshooting once the software leaves your machine. But that’s a much bigger discussion than this one.
Am I missing some great debugging tips? Feel free to let me know below :)
PS: Michael Parshin has some great tips on debugging too.
[)amien
12 responses
Nice Post. I don't know why MS decided to put all that garbage in the Output window by default!
I liked the article and found the comments after helpful as well. I'm looking for how to set my debugger to automatically save my changes and rebuild before running when I click debug. It was like this on vs2010, but we moved to vs2013 and now it doesn't. Anyone know if there is a quick toggle I could click somewhere? Thanks.
About 6. Manage breakpoints. There's Ctrl-F9 for enabling/disabling a breakpoint while on it's line.
Nice post, thanks for sharing. I guess you could add the DebuggerProxyType attribute to your list.
"If you tap F9 or click the left gutter to set breakpoints you could be easily mislead into thinking breakpoints happen at line level."
Huh? F9 has no problem setting breakpoints inside a lambda. It sets a breakpoint at the current cursor position; there's nothing line-level about it. It's only the gutter click that's line-level.
There should be a drop-down list at the top of the output window that says "Show output from:" - this needs to be set to Debug.
Great article, thanks!
But this: "Just right click in the output window (make sure output is set to debug) "
Right-clicking in the output window does not afford me the options mentioned; maybe I need to "make sure output is set to debug", but how? It's not obvious (to me, anyway).
In addition to #8, you can also put $ReturnValue into a watch window. This does require VS2013+, but also it works on Express SKUs which don't have the Autos window.
Thanks for posting these tips Damien. One comment regarding #5 (DebuggerDisplay) - I would recommend not calling functions in DebuggerDisplay attributes. One issue you pointed out is side effects, but the other problem is that function call syntax can vary between languages. If you stick to Fields and Properties, your Debugger Display attribute will work in all languages. If you really need to call a function in a DebuggerDisplay attribute for debugging purposes, it's better to wrap it in a property.
My favorite thing to do is redirect output window to immediate window, which leaves most of the output window stuff (like loading and that) in the output window but sends most of the useful out statements to the immediate window.
Thanks for the great tips Damien!
I have also made great use of System.Diagnostics.Debugger.IsAttached, which is only true when debugging, and can be used to write more detailed logging or perform other tasks not necessary in production. Code blocks that only execute when this property is true can even be left in production code.
One more I could see added to this is conditional breakpoints.